Reviving of Travel and Tourism Industry: A study focused on consumer preference for Travel post COVID
Reviving of Travel and Tourism Industry: A study focused on consumer preference for Travel post COVID
Prateek Sapra
© 2020 JETIR October
2020, Volume 7, Issue 10
Abstract
The
Novel Corona Virus (COVID-19) has changed the world as it was world as usual.
Economies of majority of nations have drop down while situation among poor or
developing nations is even worse. Since peoples are avoiding travel in order to
maintain social distance hence Travel and tourism industry is the highly
affected industry. Majority of worldwide airlines, travel companies, tour
operators and other wings associated with Travel and tourism industry are
struggling to survive in this pandemic era. Lot of peoples have lost their jobs
as organizations are operating with minimal bandwidth and are getting lean.
This research paper focuses on potential and future of Travel and tourism
industry post COVID era. Tools used to analyze the findings include secondary
data using desk research and primary data with the help of survey data to
understand the driving factors based on consumer preferences. This research
paper brought out several parameters that make an impactful presentation. Scope
of the study is to analyze first hand findings which can further help decision makers
in industry to take appropriate steps and prepare effective business strategy.
Keywords:
Reviving Travel, COVID-19, Consumer preference, Change in demand
1.
Introduction
How it
started- China reported about COVID-19 to World Health Organization’s country
office on 31st December 2019. By Mid of February more than 80,000
persons already got affected and international flights has already spreaded the
virus across the globe. Post gauging the situation World Health Organization
announcement global pandemic then countries started imposing travel
restrictions and majority of worldwide nations has shuttered down their doors
for international, intra state travel. This started impacting the several wings
connected with travel and tourism industry. Airplanes were grounded, Travel
offices got temporarily closed, Hotels and Restaurants were either temporarily
closed or all empty. Starting with “Diamond princess” wherein 700 plus
confirmed cases were detected. Seas become the trapped places as 10 odd ships
were in sea/ocean and ports denied them to dock.
1.1
Travel industry and COVID-19
Worst
phase in history of global travel industry- organization “World Travel and
Tourism Council” on March 13th 2020 has warned that COVID-19
pandemic could reduce 50 million travel and tourism jobs globally wherein Asia
is expected to be the worst affected while figures released by statista on
August 21st 2020 were even worse which indicates that 100.8 million peoples in
travel and tourism have already lost their jobs globally and as stated by WTTC
in March Asia is worst affected region which comprise of 62.89% of job loss
globally.

USA
based consultancy McKinsey in one of their report have estimated that 13.4
million jobs from restaurant industry, 3.6 million jobs from food preparation
and serving, 2.6 million jobs from restaurant servers followed by 1.3 million
jobs from restaurant cooks/chefs are at risk
While
the biggest aviation body “IATA” estimated that RPK (revenue passenger
kilometers) will be -38% as per year on year trend (2019 Vs 2020) which
comprise expected damage (revenue loss) of US$252 billion. Multiple global
carriers have requested for state aid and few of them have even filled
bankruptcy, inhibited refunds. IATA also added that most of airlines have less
than three months of liquidity and will not be able to survive for extended
period of air travel restrictions.
According
to the review of literature and aviation metrics published by IATA it has been
observed that demand for domestic travel is expected to recover faster than
international demand. Research has further analyzed that domestic air travel in
China is growing way faster than any other nation.
Below mentioned statistics clearly demonstrate that Global domestic travel is increasing way quicker than international one, though multiple other parameters are also attached which include restrictions on international air travel i.e. all countries are still not accepting international visitors, strict guidelines for e.g. Thailand tourism board has recently started accepting international tourists though tourists need to undergo 14 days mandatory quarantine followed by 90 days of minimum stay in their country and other nations are also imposing similar conditions for international tourists.

Below
mentioned metrics indicate that across globally China has recovered with
intense pace in terms of Domestic air travel.

Appeal to survive- Global bodies like “WTTC” is trying to coordinate with different nations to open their borders for international travel followed by “UN aviation task” is also appealing nations to allow tourists to travel without quarantine restrictions post collecting COVID negative report (test conducted in last 48 hours). This appeal is in regards to save drowning jobs and revive economy of the states as multiple direct and indirect jobs are associated with travel and tourism industry.
On
parallel stage it was quiet disheartening to see that no aid has been
sanctioned by Indian government for travel and tourism industry while wings
associated with travel and tourism i.e. Hospitality industry followed by
professions like Pilots are among highest tax payer to the government.
Peoples
who were under impression that travel is only about leisure and taxi service
must have got to know about impact of travel in our daily lives.
1.2
The Digital journey
The way
travel and tourism industry has dipped. Industry is expected to grow with
similar pace too. History is the evidence as peoples went for travel even after
2nd world war too, though business travel might get impacted due to
rapid use of technology as global lockdown has taught the world to work
remotely using digital platforms i.e. Zoom, Microsoft Team’s, Skype
applications have been used to conduct business meetings, coaching classes,
presentations etc.
On
parallel track Tourism businesses that do not invest in digitalization will
struggle to survive, collapse of Thomas cook U.K. is recent example.
Tech-driven
digital native companies are some of the largest and fastest growing in the
tourism sector. These include well-known examples such as Skyscanner, Expedia,
Booking.com and Airbnb.
Since
the world and India is getting digital. Indian government need to assist small
medium entrepreneurs associated with Travel and tourism industry as over 85% of
Travel setups belong to SMEs. The common problem they face while going digital
include Inadequate access to internet, Insufficient resources, skills,
financial resources and connectivity as majority of rural areas especially in
country like India still doesn’t have good internet connectivity. Policy makers
need to develop a forward looking agenda and ensure access to comparable and
timely data. Tourism businesses that do not invest in digitalization will
struggle to survive in near future.
2. RESEARCH METHODOLOGY
2.1
Statement of the research problem
To
understand the reviving potential of Travel industry post COVID era and
undertake an investigation into its effectiveness in the backdrop of customer
centric approach
2.2
Research objectives
The
objectives of the study are:
1.
To
understand consumer preference for travel post COVID
2.
To
analyze driving factors to bring tourism and travel industry back on track
2.3
Data collection
Data was
collected using close ended questions. The study is qualitative in nature
2.4
Universe of the study
Considering
ongoing pandemic situation online survey with the help of Google form has been
distributed across Delhi NCR. (Sample size – 100)
2.5 Statistical Tools
Analysis has been achieved with the assistance of
SPSS 23.0 and Microsoft Excel 2010.
2.6 Profiling Respondents


2.7
Problem Analysis
2.7.1
Consumer preference for traveling post COVID
Table 1.1- One Way ANOVA – Gender
wise consumer preference
|
ANOVA |
||||||
|
|
Sum
of Squares |
df |
Mean
Square |
F |
Sig. |
|
|
Will you consider the density of the destination you are
visiting (Considering social distancing) |
Between Groups |
7.197 |
1 |
7.197 |
3.393 |
.069 |
|
Within Groups |
203.619 |
96 |
2.121 |
|
|
|
|
Total |
210.816 |
97 |
|
|
|
|
|
Will you rely on a travel agency for itinerary planning |
Between Groups |
.726 |
1 |
.726 |
.309 |
.580 |
|
Within Groups |
227.900 |
97 |
2.349 |
|
|
|
|
Total |
228.626 |
98 |
|
|
|
|
|
Will you prefer Brand names to book your trip i.e. Make my trip,
Go-Ibibo, Chain hotels like Hyatt, Leela, etc. |
Between Groups |
11.406 |
1 |
11.406 |
5.600 |
.020 |
|
Within Groups |
197.583 |
97 |
2.037 |
|
|
|
|
Total |
208.990 |
98 |
|
|
|
|
Null hypothesis for question - Will you consider the density of the
destination you are visiting (Considering social distancing) has not been rejected
which indicates that there is no variance between the Gender wise perception.
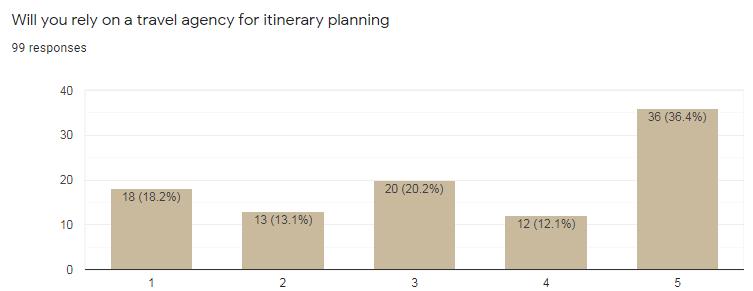
Null hypothesis for question - Will you rely on a travel agency for
itinerary planning has not been rejected which indicates that there is no
variance between the Gender wise perception.
Null hypothesis for question - Will you prefer Brand names to book your
trip i.e. Make my trip, Go-Ibibo, Chain hotels like Hyatt, Leela, etc. has been
rejected which indicates that there is variance between the Gender wise
perception. Raw data also analyze that Female respondents prefer brand names
more than males.
Table 1.2- One Way ANOVA – Age wise
consumer preference
|
ANOVA |
||||||
|
|
Sum
of Squares |
df |
Mean
Square |
F |
Sig. |
|
|
Will you consider the density of the destination you are visiting
(Considering social distancing) |
Between Groups |
6.333 |
5 |
1.267 |
.570 |
.723 |
|
Within Groups |
204.484 |
92 |
2.223 |
|
|
|
|
Total |
210.816 |
97 |
|
|
|
|
|
Will you rely on a travel agency for itinerary planning |
Between Groups |
10.326 |
5 |
2.065 |
.880 |
.498 |
|
Within Groups |
218.300 |
93 |
2.347 |
|
|
|
|
Total |
228.626 |
98 |
|
|
|
|
|
Will you prefer Brand names to book your trip i.e. Make my trip,
Go-Ibibo, Chain hotels like Hyatt, Leela, etc. |
Between Groups |
6.251 |
5 |
1.250 |
.573 |
.720 |
|
Within Groups |
202.739 |
93 |
2.180 |
|
|
|
|
Total |
208.990 |
98 |
|
|
|
|
Null hypothesis for question - Will you consider the density of the
destination you are visiting (Considering social distancing) has not been
rejected which indicates that there is no variance between the Age wise
perception.
Null hypothesis for question - Will you rely on a travel agency for
itinerary planning has not been rejected which indicates that there is no
variance between the Age wise perception.
Null hypothesis for question - Will you prefer Brand names to book your
trip i.e. Make my trip, Go-Ibibo, Chain hotels like Hyatt, Leela, etc. has not
been rejected which indicates that there is no variance between the Age wise
perception.
Table 1.3- One Way ANOVA –
Occupation wise consumer preference
|
ANOVA |
||||||
|
|
Sum
of Squares |
df |
Mean
Square |
F |
Sig. |
|
|
Will you consider the density of the destination you are
visiting (Considering social distancing) |
Between Groups |
3.932 |
3 |
1.311 |
.596 |
.619 |
|
Within Groups |
206.884 |
94 |
2.201 |
|
|
|
|
Total |
210.816 |
97 |
|
|
|
|
|
Will you rely on a travel agency for itinerary planning |
Between Groups |
3.181 |
3 |
1.060 |
.447 |
.720 |
|
Within Groups |
225.445 |
95 |
2.373 |
|
|
|
|
Total |
228.626 |
98 |
|
|
|
|
|
Will you prefer Brand names to book your trip i.e. Make my trip,
Go-Ibibo, Chain hotels like Hyatt, Leela, etc. |
Between Groups |
5.563 |
3 |
1.854 |
.866 |
.462 |
|
Within Groups |
203.427 |
95 |
2.141 |
|
|
|
|
Total |
208.990 |
98 |
|
|
|
|
Null hypothesis for question - Will you consider the density of the
destination you are visiting (Considering social distancing) has not been
rejected which indicates that there is no variance between the Occupation wise
perception.
Null hypothesis for question - Will you rely on a travel agency for
itinerary planning has not been rejected which indicates that there is no
variance between the Occupation wise perception.
Null hypothesis for question - Will you prefer Brand names to book your
trip i.e. Make my trip, Go-Ibibo, Chain hotels like Hyatt, Leela, etc. has not
been rejected which indicates that there is no variance between the Occupation
wise perception.
Table 1.4- One Way ANOVA –
Educational qualification wise consumer preference
|
ANOVA |
||||||
|
|
Sum
of Squares |
df |
Mean
Square |
F |
Sig. |
|
|
Will you consider the density of the destination you are
visiting (Considering social distancing) |
Between Groups |
4.751 |
3 |
1.584 |
.722 |
.541 |
|
Within Groups |
206.066 |
94 |
2.192 |
|
|
|
|
Total |
210.816 |
97 |
|
|
|
|
|
Will you rely on a travel agency for itinerary planning |
Between Groups |
8.338 |
3 |
2.779 |
1.199 |
.315 |
|
Within Groups |
220.288 |
95 |
2.319 |
|
|
|
|
Total |
228.626 |
98 |
|
|
|
|
|
Will you prefer Brand names to book your trip i.e. Make my trip,
Go-Ibibo, Chain hotels like Hyatt, Leela, etc. |
Between Groups |
6.335 |
3 |
2.112 |
.990 |
.401 |
|
Within Groups |
202.655 |
95 |
2.133 |
|
|
|
|
Total |
208.990 |
98 |
|
|
|
|
Null hypothesis for question - Will you consider the density of the
destination you are visiting (Considering social distancing) has not been
rejected which indicates that there is no variance between the Educational
qualification wise perception.
Null hypothesis for question - Will you rely on a travel agency for
itinerary planning has not been rejected which indicates that there is no
variance between the Educational qualification wise perception.
Null hypothesis for question - Will you prefer Brand names to book your
trip i.e. Make my trip, Go-Ibibo, Chain hotels like Hyatt, Leela, etc. has not
been rejected which indicates that there is no variance between the Educational
qualification wise perception.
Table 1.5- One Way ANOVA – Monthly Income
wise consumer preference
|
ANOVA |
||||||
|
|
Sum
of Squares |
df |
Mean
Square |
F |
Sig. |
|
|
Will you consider the density of the destination you are
visiting (Considering social distancing) |
Between Groups |
8.422 |
4 |
2.106 |
.990 |
.417 |
|
Within Groups |
185.056 |
87 |
2.127 |
|
|
|
|
Total |
193.478 |
91 |
|
|
|
|
|
Will you rely on a travel agency for itinerary planning |
Between Groups |
14.336 |
4 |
3.584 |
1.552 |
.194 |
|
Within Groups |
203.234 |
88 |
2.309 |
|
|
|
|
Total |
217.570 |
92 |
|
|
|
|
|
Will you prefer Brand names to book your trip i.e. Make my trip,
Go-Ibibo, Chain hotels like Hyatt, Leela, etc. |
Between Groups |
1.620 |
4 |
.405 |
.179 |
.949 |
|
Within Groups |
199.111 |
88 |
2.263 |
|
|
|
|
Total |
200.731 |
92 |
|
|
|
|
Null hypothesis for question - Will you consider the density of the
destination you are visiting (Considering social distancing) has not been
rejected which indicates that there is no variance between the Monthly Income
wise perception.
Null hypothesis for question - Will you rely on a travel agency for
itinerary planning has not been rejected which indicates that there is no
variance between the Monthly Income wise perception.
Null hypothesis for question - Will you prefer Brand names to book your
trip i.e. Make my trip, Go-Ibibo, Chain hotels like Hyatt, Leela, etc. has not
been rejected which indicates that there is no variance between the Monthly
Income wise perception.
Table 1.6- One Way ANOVA – Marital
Status wise consumer preference
|
ANOVA |
||||||
|
|
Sum
of Squares |
df |
Mean
Square |
F |
Sig. |
|
|
Will you consider the density of the destination you are
visiting (Considering social distancing) |
Between Groups |
.847 |
1 |
.847 |
.387 |
.535 |
|
Within Groups |
209.970 |
96 |
2.187 |
|
|
|
|
Total |
210.816 |
97 |
|
|
|
|
|
Will you rely on a travel agency for itinerary planning |
Between Groups |
2.335 |
1 |
2.335 |
1.001 |
.320 |
|
Within Groups |
226.291 |
97 |
2.333 |
|
|
|
|
Total |
228.626 |
98 |
|
|
|
|
|
Will you prefer Brand names to book your trip i.e. Make my trip,
Go-Ibibo, Chain hotels like Hyatt, Leela, etc. |
Between Groups |
2.917 |
1 |
2.917 |
1.373 |
.244 |
|
Within Groups |
206.073 |
97 |
2.124 |
|
|
|
|
Total |
208.990 |
98 |
|
|
|
|
Null hypothesis for question - Will you consider the density of the
destination you are visiting (Considering social distancing) has not been
rejected which indicates that there is no variance between the Marital Status
wise perception.
Null hypothesis for question - Will you rely on a travel agency for
itinerary planning has not been rejected which indicates that there is no
variance between the Marital Status wise perception.
Null hypothesis for question - Will you prefer Brand names to book your
trip i.e. Make my trip, Go-Ibibo, Chain hotels like Hyatt, Leela, etc. has not
been rejected which indicates that there is no variance between the Marital
Status wise perception.
2.7.2 Transportation mode preferred
by consumers post COVID
Table 1.7- One Way ANOVA – Gender wise consumer
preference for availing transportation mode post COVID
|
ANOVA |
||||||
|
|
Sum
of Squares |
df |
Mean
Square |
F |
Sig. |
|
|
What transportation mode would you like to prefer [Air (Take a
flight)] |
Between Groups |
2.519 |
1 |
2.519 |
1.853 |
.178 |
|
Within Groups |
92.467 |
68 |
1.360 |
|
|
|
|
Total |
94.986 |
69 |
|
|
|
|
|
What transportation mode would you like to prefer [Self drive -
Own vehicle] |
Between Groups |
.119 |
1 |
.119 |
.190 |
.664 |
|
Within Groups |
54.376 |
87 |
.625 |
|
|
|
|
Total |
54.494 |
88 |
|
|
|
|
|
What transportation mode would you like to prefer [Rent a Car -
Chauffeur driven] |
Between Groups |
.492 |
1 |
.492 |
.462 |
.499 |
|
Within Groups |
67.108 |
63 |
1.065 |
|
|
|
|
Total |
67.600 |
64 |
|
|
|
|
|
What transportation mode would you like to prefer [Public
transport - Train, Bus etc.] |
Between Groups |
.766 |
1 |
.766 |
.433 |
.513 |
|
Within Groups |
113.173 |
64 |
1.768 |
|
|
|
|
Total |
113.939 |
65 |
|
|
|
|
Null hypothesis for question - What transportation mode would you like
to prefer [Air (Take a flight)] has not been rejected which indicates that
there is no variance between the Gender wise perception.
Null hypothesis for question - What transportation mode would you like
to prefer [Self drive - Own vehicle] has not been rejected which indicates that
there is no variance between the Gender wise perception.
Null hypothesis for question - What transportation mode would you like
to prefer [Rent a Car - Chauffeur driven] has not been rejected which indicates
that there is no variance between the Gender wise perception.
Null hypothesis for question - What transportation mode would you like
to prefer [Public transport - Train, Bus etc.] has not been rejected which
indicates that there is no variance between the Gender wise perception.
Table 1.8- One Way ANOVA – Age wise consumer preference
for availing transportation mode post COVID
|
ANOVA |
||||||
|
|
Sum
of Squares |
df |
Mean
Square |
F |
Sig. |
|
|
What transportation mode would you like to prefer [Air (Take a
flight)] |
Between Groups |
16.115 |
5 |
3.223 |
2.615 |
.033 |
|
Within Groups |
78.870 |
64 |
1.232 |
|
|
|
|
Total |
94.986 |
69 |
|
|
|
|
|
What transportation mode would you like to prefer [Self drive -
Own vehicle] |
Between Groups |
6.047 |
5 |
1.209 |
2.072 |
.077 |
|
Within Groups |
48.447 |
83 |
.584 |
|
|
|
|
Total |
54.494 |
88 |
|
|
|
|
|
What transportation mode would you like to prefer [Rent a Car -
Chauffeur driven] |
Between Groups |
2.633 |
4 |
.658 |
.608 |
.658 |
|
Within Groups |
64.967 |
60 |
1.083 |
|
|
|
|
Total |
67.600 |
64 |
|
|
|
|
|
What transportation mode would you like to prefer [Public
transport - Train, Bus etc.] |
Between Groups |
9.341 |
5 |
1.868 |
1.072 |
.385 |
|
Within Groups |
104.598 |
60 |
1.743 |
|
|
|
|
Total |
113.939 |
65 |
|
|
|
|
Null hypothesis for question - What transportation mode would you like
to prefer [Air (Take a flight)] has been rejected which indicates that there is
variance between the Age wise perception.
Null hypothesis for question - What transportation mode would you like
to prefer [Self drive - Own vehicle] has not been rejected which indicates that
there is no variance between the Age wise perception.
Null hypothesis for question - What transportation mode would you like
to prefer [Rent a Car - Chauffeur driven] has not been rejected which indicates
that there is no variance between the Age wise perception.
Null hypothesis for question - What transportation mode would you like
to prefer [Public transport - Train, Bus etc.] has not been rejected which
indicates that there is no variance between the Age wise perception.
Table 1.9- One Way ANOVA – Occupation wise consumer
preference for availing transportation mode post COVID
|
ANOVA |
||||||
|
|
Sum
of Squares |
df |
Mean
Square |
F |
Sig. |
|
|
What transportation mode would you like to prefer [Air (Take a
flight)] |
Between Groups |
10.881 |
3 |
3.627 |
2.846 |
.044 |
|
Within Groups |
84.104 |
66 |
1.274 |
|
|
|
|
Total |
94.986 |
69 |
|
|
|
|
|
What transportation mode would you like to prefer [Self drive -
Own vehicle] |
Between Groups |
2.182 |
3 |
.727 |
1.182 |
.322 |
|
Within Groups |
52.312 |
85 |
.615 |
|
|
|
|
Total |
54.494 |
88 |
|
|
|
|
|
What transportation mode would you like to prefer [Rent a Car -
Chauffeur driven] |
Between Groups |
5.850 |
3 |
1.950 |
1.926 |
.135 |
|
Within Groups |
61.750 |
61 |
1.012 |
|
|
|
|
Total |
67.600 |
64 |
|
|
|
|
|
What transportation mode would you like to prefer [Public
transport - Train, Bus etc.] |
Between Groups |
3.432 |
3 |
1.144 |
.642 |
.591 |
|
Within Groups |
110.508 |
62 |
1.782 |
|
|
|
|
Total |
113.939 |
65 |
|
|
|
|
Null hypothesis for question - What transportation mode would you like to
prefer [Air (Take a flight)] has been rejected which indicates that there is
variance between the Occupation wise perception.
Null hypothesis for question - What transportation mode would you like
to prefer [Self drive - Own vehicle] has not been rejected which indicates that
there is no variance between the Occupation wise perception.
Null hypothesis for question - What transportation mode would you like
to prefer [Rent a Car - Chauffeur driven] has not been rejected which indicates
that there is no variance between the Occupation wise
perception.
Null hypothesis for question - What transportation mode would you like
to prefer [Public transport - Train, Bus etc.] has not been rejected which
indicates that there is no variance between the Occupation wise
perception.
Table 1.10- One Way ANOVA – Educational Qualification
wise consumer preference for availing transportation mode post COVID
|
ANOVA |
||||||
|
|
Sum
of Squares |
df |
Mean
Square |
F |
Sig. |
|
|
What transportation mode would you like to prefer [Air (Take a flight)] |
Between Groups |
11.856 |
3 |
3.952 |
3.138 |
.031 |
|
Within Groups |
83.130 |
66 |
1.260 |
|
|
|
|
Total |
94.986 |
69 |
|
|
|
|
|
What transportation mode would you like to prefer [Self drive -
Own vehicle] |
Between Groups |
4.834 |
3 |
1.611 |
2.758 |
.047 |
|
Within Groups |
49.660 |
85 |
.584 |
|
|
|
|
Total |
54.494 |
88 |
|
|
|
|
|
What transportation mode would you like to prefer [Rent a Car -
Chauffeur driven] |
Between Groups |
1.340 |
2 |
.670 |
.627 |
.538 |
|
Within Groups |
66.260 |
62 |
1.069 |
|
|
|
|
Total |
67.600 |
64 |
|
|
|
|
|
What transportation mode would you like to prefer [Public
transport - Train, Bus etc.] |
Between Groups |
6.304 |
3 |
2.101 |
1.210 |
.313 |
|
Within Groups |
107.635 |
62 |
1.736 |
|
|
|
|
Total |
113.939 |
65 |
|
|
|
|
Null hypothesis for question - What transportation mode would you like
to prefer [Air (Take a flight)] has been rejected which indicates that there is
variance between the Educational Qualification wise perception.
Null hypothesis for question - What transportation mode would you like
to prefer [Self drive - Own vehicle] has been rejected which indicates that
there is variance between the Educational Qualification wise perception.
Null hypothesis for question - What transportation mode would you like
to prefer [Rent a Car - Chauffeur driven] has not been rejected which indicates
that there is no variance between the Educational Qualification wise
perception.
Null hypothesis for question - What transportation mode would you like
to prefer [Public transport - Train, Bus etc.] has not been rejected which
indicates that there is no variance between the Educational Qualification wise
perception.
Table 1.11- One Way ANOVA – Monthly Income wise consumer
preference for availing transportation mode post COVID
|
ANOVA |
||||||
|
|
Sum
of Squares |
df |
Mean
Square |
F |
Sig. |
|
|
What transportation mode would you like to prefer [Air (Take a
flight)] |
Between Groups |
13.300 |
4 |
3.325 |
2.831 |
.032 |
|
Within Groups |
72.819 |
62 |
1.175 |
|
|
|
|
Total |
86.119 |
66 |
|
|
|
|
|
What transportation mode would you like to prefer [Self drive -
Own vehicle] |
Between Groups |
1.470 |
4 |
.367 |
.740 |
.568 |
|
Within Groups |
38.747 |
78 |
.497 |
|
|
|
|
Total |
40.217 |
82 |
|
|
|
|
|
What transportation mode would you like to prefer [Rent a Car -
Chauffeur driven] |
Between Groups |
7.259 |
4 |
1.815 |
1.779 |
.145 |
|
Within Groups |
60.179 |
59 |
1.020 |
|
|
|
|
Total |
67.437 |
63 |
|
|
|
|
|
What transportation mode would you like to prefer [Public
transport - Train, Bus etc.] |
Between Groups |
8.349 |
4 |
2.087 |
1.230 |
.308 |
|
Within Groups |
100.089 |
59 |
1.696 |
|
|
|
|
Total |
108.438 |
63 |
|
|
|
|
Null hypothesis for question - What transportation mode would you like
to prefer [Air (Take a flight)] has been rejected which indicates that there is
variance between the Monthly Income wise perception.
Null hypothesis for question - What transportation mode would you like
to prefer [Self drive - Own vehicle] has not been rejected which indicates that
there is no variance between the Monthly Income wise perception.
Null hypothesis for question - What transportation mode would you like
to prefer [Rent a Car - Chauffeur driven] has not been rejected which indicates
that there is no variance between the Monthly Income wise perception.
Null hypothesis for question - What transportation mode would you like
to prefer [Public transport - Train, Bus etc.] has not been rejected which
indicates that there is no variance between the Monthly Income wise perception.
Table 1.12- One Way ANOVA – Marital Status wise consumer
preference for availing transportation mode post COVID
|
ANOVA |
||||||
|
|
Sum
of Squares |
df |
Mean
Square |
F |
Sig. |
|
|
What transportation mode would you like to prefer [Air (Take a
flight)] |
Between Groups |
8.953 |
1 |
8.953 |
7.076 |
.010 |
|
Within Groups |
86.033 |
68 |
1.265 |
|
|
|
|
Total |
94.986 |
69 |
|
|
|
|
|
What transportation mode would you like to prefer [Self drive -
Own vehicle] |
Between Groups |
1.315 |
1 |
1.315 |
2.152 |
.146 |
|
Within Groups |
53.179 |
87 |
.611 |
|
|
|
|
Total |
54.494 |
88 |
|
|
|
|
|
What transportation mode would you like to prefer [Rent a Car -
Chauffeur driven] |
Between Groups |
1.819 |
1 |
1.819 |
1.743 |
.192 |
|
Within Groups |
65.781 |
63 |
1.044 |
|
|
|
|
Total |
67.600 |
64 |
|
|
|
|
|
What transportation mode would you like to prefer [Public
transport - Train, Bus etc.] |
Between Groups |
.008 |
1 |
.008 |
.004 |
.948 |
|
Within Groups |
113.932 |
64 |
1.780 |
|
|
|
|
Total |
113.939 |
65 |
|
|
|
|
Null hypothesis for question - What transportation mode would you like
to prefer [Air (Take a flight)] has been rejected which indicates that there is
variance between the Marital Status wise perception.
Null hypothesis for question - What transportation mode would you like
to prefer [Self drive - Own vehicle] has not been rejected which indicates that
there is no variance between the Marital Status wise perception.
Null hypothesis for question - What transportation mode would you like
to prefer [Rent a Car - Chauffeur driven] has not been rejected which indicates
that there is no variance between the Marital Status wise perception.
Null hypothesis for question - What transportation mode would you like
to prefer [Public transport - Train, Bus etc.] has not been rejected which
indicates that there is no variance between the Marital Status wise perception.
2.7.3 Factors influencing consumers
to purchase travel products post COVID
Table 1.13- One Way ANOVA – Gender wise consumer
preference for Factors influencing to purchase travel products post COVID
|
ANOVA |
||||||
|
|
Sum
of Squares |
df |
Mean
Square |
F |
Sig. |
|
|
Factors influencing you to purchase travel products post COVID
[Hygiene] |
Between Groups |
.677 |
1 |
.677 |
1.622 |
.206 |
|
Within Groups |
38.429 |
92 |
.418 |
|
|
|
|
Total |
39.106 |
93 |
|
|
|
|
|
Factors influencing you to purchase travel products post COVID
[Social distancing] |
Between Groups |
.062 |
1 |
.062 |
.119 |
.731 |
|
Within Groups |
47.164 |
91 |
.518 |
|
|
|
|
Total |
47.226 |
92 |
|
|
|
|
|
Factors influencing you to purchase travel products post COVID [Promotional
offers] |
Between Groups |
.008 |
1 |
.008 |
.008 |
.929 |
|
Within Groups |
85.256 |
85 |
1.003 |
|
|
|
|
Total |
85.264 |
86 |
|
|
|
|
|
Factors influencing you to purchase travel products post COVID
[Travel Experience] |
Between Groups |
.002 |
1 |
.002 |
.003 |
.954 |
|
Within Groups |
60.320 |
91 |
.663 |
|
|
|
|
Total |
60.323 |
92 |
|
|
|
|
Null hypothesis for question - Factors influencing you to purchase
travel products post COVID [Hygiene] has not been rejected which indicates that
there is no variance between the Gender wise perception.
Null hypothesis for question - Factors influencing you to purchase
travel products post COVID [Social distancing] has not been rejected which
indicates that there is no variance between the Gender wise perception.
Null hypothesis for question - Factors influencing you to purchase
travel products post COVID [Promotional offers] has not been rejected which
indicates that there is no variance between the Gender wise perception.
Null hypothesis for question - Factors influencing you to purchase
travel products post COVID [Travel Experience] has not been rejected which
indicates that there is no variance between the Gender wise perception.
Table 1.14- One Way ANOVA – Age wise consumer preference
for Factors influencing to purchase travel products post COVID
|
ANOVA |
||||||
|
|
Sum
of Squares |
df |
Mean
Square |
F |
Sig. |
|
|
Factors influencing you to purchase travel products post COVID
[Hygiene] |
Between Groups |
1.026 |
5 |
.205 |
.474 |
.795 |
|
Within Groups |
38.080 |
88 |
.433 |
|
|
|
|
Total |
39.106 |
93 |
|
|
|
|
|
Factors influencing you to purchase travel products post COVID
[Social distancing] |
Between Groups |
1.026 |
4 |
.256 |
.488 |
.744 |
|
Within Groups |
46.200 |
88 |
.525 |
|
|
|
|
Total |
47.226 |
92 |
|
|
|
|
|
Factors influencing you to purchase travel products post COVID
[Promotional offers] |
Between Groups |
3.316 |
5 |
.663 |
.655 |
.658 |
|
Within Groups |
81.949 |
81 |
1.012 |
|
|
|
|
Total |
85.264 |
86 |
|
|
|
|
|
Factors influencing you to purchase travel products post COVID
[Travel Experience] |
Between Groups |
1.170 |
5 |
.234 |
.344 |
.885 |
|
Within Groups |
59.153 |
87 |
.680 |
|
|
|
|
Total |
60.323 |
92 |
|
|
|
|
Null hypothesis for question - Factors influencing you to purchase
travel products post COVID [Hygiene] has not been rejected which indicates that
there is no variance between the Age wise perception.
Null hypothesis for question - Factors influencing you to purchase
travel products post COVID [Social distancing] has not been rejected which
indicates that there is no variance between the Age wise perception.
Null hypothesis for question - Factors influencing you to purchase
travel products post COVID [Promotional offers] has not been rejected which
indicates that there is no variance between the Age wise perception.
Null hypothesis for question - Factors influencing you to purchase
travel products post COVID [Travel Experience] has not been rejected which indicates
that there is no variance between the Age wise perception.
Table 1.15- One Way ANOVA – Occupation wise consumer
preference for Factors influencing to purchase travel products post COVID
|
ANOVA |
||||||
|
|
Sum
of Squares |
df |
Mean
Square |
F |
Sig. |
|
|
Factors influencing you to purchase travel products post COVID
[Hygiene] |
Between Groups |
.288 |
3 |
.096 |
.223 |
.880 |
|
Within Groups |
38.818 |
90 |
.431 |
|
|
|
|
Total |
39.106 |
93 |
|
|
|
|
|
Factors influencing you to purchase travel products post COVID
[Social distancing] |
Between Groups |
.541 |
3 |
.180 |
.344 |
.794 |
|
Within Groups |
46.685 |
89 |
.525 |
|
|
|
|
Total |
47.226 |
92 |
|
|
|
|
|
Factors influencing you to purchase travel products post COVID
[Promotional offers] |
Between Groups |
1.234 |
3 |
.411 |
.406 |
.749 |
|
Within Groups |
84.030 |
83 |
1.012 |
|
|
|
|
Total |
85.264 |
86 |
|
|
|
|
|
Factors influencing you to purchase travel products post COVID
[Travel Experience] |
Between Groups |
.952 |
3 |
.317 |
.476 |
.700 |
|
Within Groups |
59.371 |
89 |
.667 |
|
|
|
|
Total |
60.323 |
92 |
|
|
|
|
Null hypothesis for question - Factors influencing you to purchase
travel products post COVID [Hygiene] has not been rejected which indicates that
there is no variance between the Occupation wise perception.
Null hypothesis for question - Factors influencing you to purchase
travel products post COVID [Social distancing] has not been rejected which
indicates that there is no variance between the Occupation wise perception.
Null hypothesis for question - Factors influencing you to purchase
travel products post COVID [Promotional offers] has not been rejected which
indicates that there is no variance between the Occupation wise perception.
Null hypothesis for question - Factors influencing you to purchase
travel products post COVID [Travel Experience] has not been rejected which
indicates that there is no variance between the Occupation wise perception.
Table 1.16- One Way ANOVA – Educational qualification
wise consumer preference for Factors influencing to purchase travel products
post COVID
|
ANOVA |
||||||
|
|
Sum
of Squares |
df |
Mean
Square |
F |
Sig. |
|
|
Factors influencing you to purchase travel products post COVID
[Hygiene] |
Between Groups |
.315 |
3 |
.105 |
.244 |
.866 |
|
Within Groups |
38.791 |
90 |
.431 |
|
|
|
|
Total |
39.106 |
93 |
|
|
|
|
|
Factors influencing you to purchase travel products post COVID
[Social distancing] |
Between Groups |
.845 |
3 |
.282 |
.541 |
.656 |
|
Within Groups |
46.381 |
89 |
.521 |
|
|
|
|
Total |
47.226 |
92 |
|
|
|
|
|
Factors influencing you to purchase travel products post COVID
[Promotional offers] |
Between Groups |
10.285 |
3 |
3.428 |
3.795 |
.013 |
|
Within Groups |
74.980 |
83 |
.903 |
|
|
|
|
Total |
85.264 |
86 |
|
|
|
|
|
Factors influencing you to purchase travel products post COVID
[Travel Experience] |
Between Groups |
1.659 |
3 |
.553 |
.839 |
.476 |
|
Within Groups |
58.663 |
89 |
.659 |
|
|
|
|
Total |
60.323 |
92 |
|
|
|
|
Null hypothesis for question - Factors influencing you to purchase
travel products post COVID [Hygiene] has not been rejected which indicates that
there is no variance between the Educational qualification wise perception.
Null hypothesis for question - Factors influencing you to purchase
travel products post COVID [Educational qualification distancing] has not been
rejected which indicates that there is no variance between the Occupation wise
perception.
Null hypothesis for question - Factors influencing you to purchase
travel products post COVID [Promotional offers] has been rejected which
indicates that there is variance between the Educational qualification wise
perception.
Null hypothesis for question - Factors influencing you to purchase
travel products post COVID [Travel Experience] has not been rejected which
indicates that there is no variance between the Educational qualification wise
perception.
Table 1.17- One Way ANOVA – Monthly Income wise consumer
preference for Factors influencing to purchase travel products post COVID
|
ANOVA |
||||||
|
|
Sum
of Squares |
df |
Mean
Square |
F |
Sig. |
|
|
Factors influencing you to purchase travel products post COVID
[Hygiene] |
Between Groups |
1.035 |
4 |
.259 |
.590 |
.671 |
|
Within Groups |
37.288 |
85 |
.439 |
|
|
|
|
Total |
38.322 |
89 |
|
|
|
|
|
Factors influencing you to purchase travel products post COVID
[Social distancing] |
Between Groups |
.252 |
4 |
.063 |
.115 |
.977 |
|
Within Groups |
45.995 |
84 |
.548 |
|
|
|
|
Total |
46.247 |
88 |
|
|
|
|
|
Factors influencing you to purchase travel products post COVID
[Promotional offers] |
Between Groups |
1.280 |
4 |
.320 |
.310 |
.870 |
|
Within Groups |
81.529 |
79 |
1.032 |
|
|
|
|
Total |
82.810 |
83 |
|
|
|
|
|
Factors influencing you to purchase travel products post COVID
[Travel Experience] |
Between Groups |
1.821 |
4 |
.455 |
.671 |
.614 |
|
Within Groups |
56.988 |
84 |
.678 |
|
|
|
|
Total |
58.809 |
88 |
|
|
|
|
Null hypothesis for question - Factors influencing you to purchase
travel products post COVID [Hygiene] has not been rejected which indicates that
there is no variance between the Monthly Income wise perception.
Null hypothesis for question - Factors influencing you to purchase
travel products post COVID [Social distancing] has not been rejected which
indicates that there is no variance between the Monthly Income wise perception.
Null hypothesis for question - Factors influencing you to purchase
travel products post COVID [Promotional offers] has not been rejected which
indicates that there is no variance between the Monthly Income wise perception.
Null hypothesis for question - Factors influencing you to purchase travel
products post COVID [Travel Experience] has not been rejected which indicates
that there is no variance between the Monthly Income wise perception.
Table 1.18- One Way ANOVA – Marital Status wise consumer
preference for Factors influencing to purchase travel products post COVID
|
ANOVA |
||||||
|
|
Sum
of Squares |
df |
Mean
Square |
F |
Sig. |
|
|
Factors influencing you to purchase travel products post COVID
[Hygiene] |
Between Groups |
.125 |
1 |
.125 |
.294 |
.589 |
|
Within Groups |
38.982 |
92 |
.424 |
|
|
|
|
Total |
39.106 |
93 |
|
|
|
|
|
Factors influencing you to purchase travel products post COVID
[Social distancing] |
Between Groups |
.018 |
1 |
.018 |
.035 |
.852 |
|
Within Groups |
47.208 |
91 |
.519 |
|
|
|
|
Total |
47.226 |
92 |
|
|
|
|
|
Factors influencing you to purchase travel products post COVID
[Promotional offers] |
Between Groups |
.104 |
1 |
.104 |
.104 |
.748 |
|
Within Groups |
85.160 |
85 |
1.002 |
|
|
|
|
Total |
85.264 |
86 |
|
|
|
|
|
Factors influencing you to purchase travel products post COVID
[Travel Experience] |
Between Groups |
.066 |
1 |
.066 |
.099 |
.754 |
|
Within Groups |
60.257 |
91 |
.662 |
|
|
|
|
Total |
60.323 |
92 |
|
|
|
|
Null hypothesis for question - Factors influencing you to purchase
travel products post COVID [Hygiene] has not been rejected which indicates that
there is no variance between the Marital Status wise perception.
Null hypothesis for question - Factors influencing you to purchase
travel products post COVID [Social distancing] has not been rejected which
indicates that there is no variance between the Marital Status wise perception.
Null hypothesis for question - Factors influencing you to purchase
travel products post COVID [Promotional offers] has not been rejected which
indicates that there is no variance between the Marital Status wise perception.
Null hypothesis for question - Factors influencing you to purchase
travel products post COVID [Travel Experience] has not been rejected which
indicates that there is no variance between the Marital Status wise perception.
2.7.4 Chi-Square analysis: Case processing
summary- purpose of trip for next trip post COVID
It is a summary of effect of selected demographic
variables (gender, age, marital status, income, education and occupation) on
the overall consumer with regards to
purpose of trip for next trip post COVID.
Table
1.19- Case Processing Summary with regards to purpose of trip for next trip
post COVID
|
Case Processing Summary |
||||||
|
|
Cases |
|||||
|
Valid |
Missing |
Total |
||||
|
N |
Percent |
N |
Percent |
N |
Percent |
|
|
Gender * What would be
the purpose of your next Trip |
100 |
100.0% |
0 |
0.0% |
100 |
100.0% |
|
Age * What would be
the purpose of your next Trip |
100 |
100.0% |
0 |
0.0% |
100 |
100.0% |
|
Occupation * What
would be the purpose of your next Trip |
100 |
100.0% |
0 |
0.0% |
100 |
100.0% |
|
Educational
Qualification * What would be the purpose of your next Trip |
100 |
100.0% |
0 |
0.0% |
100 |
100.0% |
|
Monthly Income * What
would be the purpose of your next Trip |
100 |
100.0% |
0 |
0.0% |
100 |
100.0% |
|
Marital Status * What
would be the purpose of your next Trip |
100 |
100.0% |
0 |
0.0% |
100 |
100.0% |
Table 1.20- Chi-square Analysis: Gender and purpose of
next Trip
|
Gender
* What would be the purpose of your next Trip Crosstabulation |
||||||||
|
Count |
||||||||
|
|
What
would be the purpose of your next Trip |
Total |
||||||
|
|
Adventure |
Business |
Leisure |
Other |
Pilgrimage |
|||
|
Gender |
Female |
0 |
9 |
0 |
28 |
6 |
0 |
43 |
|
Male |
1 |
15 |
4 |
28 |
5 |
4 |
57 |
|
|
Total |
1 |
24 |
4 |
56 |
11 |
4 |
100 |
|
Table
1.20.1
|
Chi-Square
Tests |
|||
|
|
Value |
Df |
Asymptotic
Significance (2-sided) |
|
Pearson Chi-Square |
8.803a |
5 |
.117 |
|
Likelihood Ratio |
12.117 |
5 |
.033 |
|
N of Valid Cases |
100 |
|
|
|
a. 7 cells (58.3%) have expected count less than 5. The minimum
expected count is .43. |
|||
As the significance value in the above selected
demographic variables cross-tabulation value is greater than 0.05 so H0 is not
rejected. Hence it can be concluded that there is no variance in Gender wise
preferences.
Table 1.21- Chi-square Analysis: Age and purpose of next
Trip
|
Age
* What would be the purpose of your next Trip Crosstabulation |
||||||||
|
Count |
||||||||
|
|
What
would be the purpose of your next Trip |
Total |
||||||
|
|
Adventure |
Business |
Leisure |
Other |
Pilgrimage |
|||
|
Age |
21-30 |
0 |
13 |
2 |
34 |
5 |
1 |
55 |
|
31-40 |
1 |
8 |
0 |
14 |
6 |
1 |
30 |
|
|
41-50 |
0 |
1 |
0 |
3 |
0 |
1 |
5 |
|
|
51-60 |
0 |
0 |
2 |
5 |
0 |
0 |
7 |
|
|
61 or Above |
0 |
1 |
0 |
0 |
0 |
0 |
1 |
|
|
Under 20 |
0 |
1 |
0 |
0 |
0 |
1 |
2 |
|
|
Total |
1 |
24 |
4 |
56 |
11 |
4 |
100 |
|
Table
1.21.1
|
Chi-Square
Tests |
|||
|
|
Value |
Df |
Asymptotic
Significance (2-sided) |
|
Pearson Chi-Square |
40.833a |
25 |
.024 |
|
Likelihood Ratio |
31.198 |
25 |
.183 |
|
N of Valid Cases |
100 |
|
|
|
a. 31 cells (86.1%) have expected count less than 5. The minimum
expected count is .01. |
|||
As the significance value in the above selected
demographic variables cross-tabulation value is less than 0.05 so H0 is
rejected. Hence it can be concluded that there is variance in Age wise
preferences. Below mentioned observation from raw data also indicate majority
of respondents prefer to travel for leisure purpose and maximum respondents
preferring leisure travel belong to youth age group.
Table
1.21.2
|
Purpose of Travel |
Age group |
Grand Total |
|||||
|
21-30 |
31-40 |
41-50 |
51-60 |
61 or Above |
Under 20 |
||
|
Adventure |
13 |
8 |
1 |
|
1 |
1 |
24 |
|
Business |
2 |
|
|
2 |
|
|
4 |
|
Leisure |
34 |
14 |
3 |
5 |
|
|
56 |
|
Other |
5 |
6 |
|
|
|
|
11 |
|
Pilgrimage |
1 |
1 |
1 |
|
|
1 |
4 |
|
(blank) |
|
1 |
|
|
|
|
1 |
|
Grand Total |
55 |
30 |
5 |
7 |
1 |
2 |
100 |
Table 1.22- Chi-square Analysis: Occupation and purpose
of next Trip
|
Occupation
* What would be the purpose of your next Trip Crosstabulation |
||||||||
|
Count |
||||||||
|
|
What
would be the purpose of your next Trip |
Total |
||||||
|
|
Adventure |
Business |
Leisure |
Other |
Pilgrimage |
|||
|
Occupation |
Business |
0 |
2 |
1 |
5 |
0 |
0 |
8 |
|
Service |
0 |
11 |
2 |
32 |
7 |
3 |
55 |
|
|
Student |
1 |
8 |
1 |
17 |
3 |
1 |
31 |
|
|
Unemployed |
0 |
3 |
0 |
2 |
1 |
0 |
6 |
|
|
Total |
1 |
24 |
4 |
56 |
11 |
4 |
100 |
|
Table
1.22.1
|
Chi-Square
Tests |
|||
|
|
Value |
df |
Asymptotic
Significance (2-sided) |
|
Pearson Chi-Square |
8.894a |
15 |
.883 |
|
Likelihood Ratio |
9.819 |
15 |
.831 |
|
N of Valid Cases |
100 |
|
|
|
a. 19 cells (79.2%) have expected count less than 5. The minimum
expected count is .06. |
|||
As the significance value in the above selected
demographic variables cross-tabulation value is greater than 0.05 so H0 is not
rejected. Hence it can be concluded that there is no variance in Occupation
wise preferences.
Table 1.23- Chi-square Analysis: Educational
Qualification and purpose of next Trip
|
Educational
Qualification * What would be the purpose of your next Trip Crosstabulation |
||||||||
|
Count |
||||||||
|
|
What
would be the purpose of your next Trip |
Total |
||||||
|
|
Adventure |
Business |
Leisure |
Other |
Pilgrimage |
|||
|
Educational Qualification |
Doctorate |
0 |
2 |
1 |
7 |
0 |
0 |
10 |
|
Graduate |
0 |
9 |
0 |
18 |
6 |
2 |
35 |
|
|
Post Graduate |
1 |
11 |
3 |
31 |
5 |
1 |
52 |
|
|
Under Graduate |
0 |
2 |
0 |
0 |
0 |
1 |
3 |
|
|
Total |
1 |
24 |
4 |
56 |
11 |
4 |
100 |
|
Table
1.23.1
|
Chi-Square
Tests |
|||
|
|
Value |
df |
Asymptotic
Significance (2-sided) |
|
Pearson Chi-Square |
18.985a |
15 |
.214 |
|
Likelihood Ratio |
19.279 |
15 |
.201 |
|
N of Valid Cases |
100 |
|
|
|
a. 18 cells (75.0%) have expected count less than 5. The minimum
expected count is .03. |
|||
As the significance value in the above selected
demographic variables cross-tabulation value is greater than 0.05 so H0 is not
rejected. Hence it can be concluded that there is no variance in Educational
Qualification wise preferences.
|
Monthly
Income * What would be the purpose of your next Trip Crosstabulation |
||||||||
|
Count |
||||||||
|
|
What
would be the purpose of your next Trip |
Total |
||||||
|
|
Adventure |
Business |
Leisure |
Other |
Pilgrimage |
|||
|
Monthly Income |
|
1 |
2 |
0 |
2 |
1 |
1 |
7 |
|
20,001 - 40,000 |
0 |
6 |
0 |
16 |
2 |
1 |
25 |
|
|
40,001 - 50,000 |
0 |
1 |
0 |
9 |
3 |
0 |
13 |
|
|
50,001 - 75,000 |
0 |
3 |
0 |
9 |
1 |
1 |
14 |
|
|
75,001 Above |
0 |
4 |
2 |
11 |
1 |
1 |
19 |
|
|
Below 20,000 |
0 |
8 |
2 |
9 |
3 |
0 |
22 |
|
|
Total |
1 |
24 |
4 |
56 |
11 |
4 |
100 |
|
Table
1.24.1
|
Chi-Square
Tests |
|||
|
|
Value |
df |
Asymptotic
Significance (2-sided) |
|
Pearson Chi-Square |
31.382a |
25 |
.177 |
|
Likelihood Ratio |
25.677 |
25 |
.425 |
|
N of Valid Cases |
100 |
|
|
|
a. 29 cells (80.6%) have expected count less than 5. The minimum
expected count is .07. |
|||
As the significance value in the above selected
demographic variables cross-tabulation value is greater than 0.05 so H0 is not
rejected. Hence it can be concluded that there is no variance in Monthly Income wise preferences.
Table 1.25- Chi-square Analysis: Marital Status and
purpose of next Trip
|
Marital
Status * What would be the purpose of your next Trip Crosstabulation |
||||||||
|
Count |
||||||||
|
|
What
would be the purpose of your next Trip |
Total |
||||||
|
|
Adventure |
Business |
Leisure |
Other |
Pilgrimage |
|||
|
Marital Status |
Married |
0 |
8 |
4 |
27 |
4 |
1 |
44 |
|
Unmarried |
1 |
16 |
0 |
29 |
7 |
3 |
56 |
|
|
Total |
1 |
24 |
4 |
56 |
11 |
4 |
100 |
|
Table
1.25.1
|
Chi-Square
Tests |
|||
|
|
Value |
df |
Asymptotic
Significance (2-sided) |
|
Pearson Chi-Square |
8.235a |
5 |
.144 |
|
Likelihood Ratio |
10.153 |
5 |
.071 |
|
N of Valid Cases |
100 |
|
|
|
a. 7 cells (58.3%) have expected count less than 5. The minimum
expected count is .44. |
|||
As the significance value in the above selected
demographic variables cross-tabulation value is greater than 0.05 so H0 is not
rejected. Hence it can be concluded that there is no variance in Marital Status
wise preferences.
2.7.4 Chi-Square analysis: Case processing
summary- likely destination for next trip post COVID
It is a summary of effect of selected demographic
variables (gender, age, marital status, income, education and occupation) on
the overall consumer with regards to likely destination for next trip post
COVID.
Table
1.26- Case Processing Summary- likely destination for next trip post COVID
|
Case Processing
Summary |
||||||
|
|
Cases |
|
|
|
|
|
|
|
Valid |
|
Missing |
|
Total |
|
|
|
N |
Percent |
N |
Percent |
N |
Percent |
|
Gender * Likely
destination for your Next Trip |
100 |
100.0% |
0 |
0.0% |
100 |
100.0% |
|
Age * Likely
destination for your Next Trip |
100 |
100.0% |
0 |
0.0% |
100 |
100.0% |
|
Occupation * Likely
destination for your Next Trip |
100 |
100.0% |
0 |
0.0% |
100 |
100.0% |
|
Educational
Qualification * Likely destination for your Next Trip |
100 |
100.0% |
0 |
0.0% |
100 |
100.0% |
|
Monthly Income *
Likely destination for your Next Trip |
100 |
100.0% |
0 |
0.0% |
100 |
100.0% |
|
Marital Status *
Likely destination for your Next Trip |
100 |
100.0% |
0 |
0.0% |
100 |
100.0% |
Table 1.27- Chi-square
Analysis: Gender and likely destination for next trip post COVID
|
Gender
* Likely destination for your Next Trip Crosstabulation |
||||||
|
Count |
||||||
|
|
Likely
destination for your Next Trip |
Total |
||||
|
|
Foreign
(Beyond country) |
I
have no travel plans |
Within
Country |
|||
|
Gender |
Female |
0 |
4 |
6 |
33 |
43 |
|
Male |
1 |
3 |
11 |
42 |
57 |
|
|
Total |
1 |
7 |
17 |
75 |
100 |
|
Table
1.27.1
|
Chi-Square
Tests |
|||
|
|
Value |
df |
Asymptotic
Significance (2-sided) |
|
Pearson Chi-Square |
1.768a |
3 |
.622 |
|
Likelihood Ratio |
2.138 |
3 |
.544 |
|
N of Valid Cases |
100 |
|
|
|
a. 4 cells (50.0%) have expected count less than 5. The minimum
expected count is .43. |
|||
As the significance value in the above selected
demographic variables cross-tabulation value is greater than 0.05 so H0 is not
rejected. Hence it can be concluded that there is no variance in Gender wise preferences.
Table 1.28- Chi-square Analysis: Age and likely
destination for next trip post COVID
|
Age
* Likely destination for your Next Trip Crosstabulation |
||||||
|
Count |
||||||
|
|
Likely
destination for your Next Trip |
Total |
||||
|
|
Foreign
(Beyond country) |
I have
no travel plans |
Within
Country |
|||
|
Age |
21-30 |
0 |
2 |
12 |
41 |
55 |
|
31-40 |
1 |
3 |
3 |
23 |
30 |
|
|
41-50 |
0 |
0 |
1 |
4 |
5 |
|
|
51-60 |
0 |
2 |
1 |
4 |
7 |
|
|
61 or Above |
0 |
0 |
0 |
1 |
1 |
|
|
Under 20 |
0 |
0 |
0 |
2 |
2 |
|
|
Total |
1 |
7 |
17 |
75 |
100 |
|
Table
1.28.1
|
Chi-Square
Tests |
|||
|
|
Value |
df |
Asymptotic
Significance (2-sided) |
|
Pearson Chi-Square |
11.581a |
15 |
.710 |
|
Likelihood Ratio |
10.916 |
15 |
.759 |
|
N of Valid Cases |
100 |
|
|
|
a. 19 cells (79.2%) have expected count less than 5. The minimum
expected count is .01. |
|||
As the significance value in the above selected
demographic variables cross-tabulation value is greater than 0.05 so H0 is not
rejected. Hence it can be concluded that there is no variance in Age wise
preferences.
Table 1.29- Chi-square Analysis: Occupation and likely
destination for next trip post COVID
|
Occupation
* Likely destination for your Next Trip Crosstabulation |
||||||
|
Count |
||||||
|
|
Likely
destination for your Next Trip |
Total |
||||
|
|
Foreign
(Beyond country) |
I
have no travel plans |
Within
Country |
|||
|
Occupation |
Business |
0 |
2 |
1 |
5 |
8 |
|
Service |
0 |
3 |
10 |
42 |
55 |
|
|
Student |
1 |
1 |
5 |
24 |
31 |
|
|
Unemployed |
0 |
1 |
1 |
4 |
6 |
|
|
Total |
1 |
7 |
17 |
75 |
100 |
|
Table
1.29.1
|
Chi-Square
Tests |
|||
|
|
Value |
df |
Asymptotic
Significance (2-sided) |
|
Pearson Chi-Square |
7.963a |
9 |
.538 |
|
Likelihood Ratio |
6.559 |
9 |
.683 |
|
N of Valid Cases |
100 |
|
|
|
a. 11 cells (68.8%) have expected count less than 5. The minimum
expected count is .06. |
|||
As the significance value in the above selected
demographic variables cross-tabulation value is greater than 0.05 so H0 is not
rejected. Hence it can be concluded that there is no variance in Occupation wise
preferences.
Table 1.30- Chi-square Analysis:
Educational Qualification and likely destination for next trip post COVID
|
Educational
Qualification * Likely destination for your Next Trip Crosstabulation |
||||||
|
Count |
||||||
|
|
Likely
destination for your Next Trip |
Total |
||||
|
|
Foreign
(Beyond country) |
I
have no travel plans |
Within
Country |
|||
|
Educational Qualification |
Doctorate |
0 |
1 |
0 |
9 |
10 |
|
Graduate |
0 |
3 |
8 |
24 |
35 |
|
|
Post Graduate |
1 |
3 |
9 |
39 |
52 |
|
|
Under Graduate |
0 |
0 |
0 |
3 |
3 |
|
|
Total |
1 |
7 |
17 |
75 |
100 |
|
Table
1.30.1
|
Chi-Square
Tests |
|||
|
|
Value |
df |
Asymptotic
Significance (2-sided) |
|
Pearson Chi-Square |
5.160a |
9 |
.820 |
|
Likelihood Ratio |
7.842 |
9 |
.550 |
|
N of Valid Cases |
100 |
|
|
|
a. 11 cells (68.8%) have expected count less than 5. The minimum
expected count is .03. |
|||
As the significance value in the above selected
demographic variables cross-tabulation value is greater than 0.05 so H0 is not
rejected. Hence it can be concluded that there is no variance in Educational
Qualification wise preferences.
Table 1.31- Chi-square
Analysis: Monthly Income and likely destination for next trip post COVID
|
Monthly
Income * Likely destination for your Next Trip Crosstabulation |
||||||
|
Count |
||||||
|
|
Likely
destination for your Next Trip |
Total |
||||
|
|
Foreign
(Beyond country) |
I
have no travel plans |
Within
Country |
|||
|
Monthly Income |
|
1 |
1 |
0 |
5 |
7 |
|
20,001 - 40,000 |
0 |
2 |
5 |
18 |
25 |
|
|
40,001 - 50,000 |
0 |
1 |
2 |
10 |
13 |
|
|
50,001 - 75,000 |
0 |
0 |
2 |
12 |
14 |
|
|
75,001 Above |
0 |
1 |
3 |
15 |
19 |
|
|
Below 20,000 |
0 |
2 |
5 |
15 |
22 |
|
|
Total |
1 |
7 |
17 |
75 |
100 |
|
Table
1.31.1
|
Chi-Square
Tests |
|||
|
|
Value |
df |
Asymptotic
Significance (2-sided) |
|
Pearson Chi-Square |
17.343a |
15 |
.299 |
|
Likelihood Ratio |
11.366 |
15 |
.726 |
|
N of Valid Cases |
100 |
|
|
|
a. 18 cells (75.0%) have expected count less than 5. The minimum
expected count is .07. |
|||
As the significance value in the above selected
demographic variables cross-tabulation value is greater than 0.05 so H0 is not
rejected. Hence it can be concluded that there is no variance in Monthly Income
wise preferences.
Table 1.32: Chi-square Analysis: Marital Status and likely
destination for next trip post COVID
|
Marital
Status * Likely destination for your Next Trip Crosstabulation |
||||||
|
Count |
||||||
|
|
Likely
destination for your Next Trip |
Total |
||||
|
|
Foreign
(Beyond country) |
I
have no travel plans |
Within
Country |
|||
|
Marital Status |
Married |
0 |
2 |
6 |
36 |
44 |
|
Unmarried |
1 |
5 |
11 |
39 |
56 |
|
|
Total |
1 |
7 |
17 |
75 |
100 |
|
Table
1.32.1
|
Chi-Square
Tests |
|||
|
|
Value |
df |
Asymptotic
Significance (2-sided) |
|
Pearson Chi-Square |
2.472a |
3 |
.480 |
|
Likelihood Ratio |
2.884 |
3 |
.410 |
|
N of Valid Cases |
100 |
|
|
|
a. 4 cells (50.0%) have expected count less than 5. The minimum
expected count is .44. |
|||
As the significance value in the above selected
demographic variables cross-tabulation value is greater than 0.05 so H0 is not
rejected. Hence it can be concluded that there is no variance in Marital Status
wise preferences.
3.
Findings and Conclusions
High
internet penetration rate is helping emerging nations like India to revive
economy during pandemic. India is second largest online market just after
China. Though tourism require physical presence and that’s the reason our
industry got worsly impacted due to pandemic though digital transactions
followed by digital campaigns, digital marketing are helping Industry to
revive. Consumer preference in terms of different demographics- Gender, Age,
Occupation, Educational Qualification, Monthly Income and Marital status may
vary while choosing travel products post Covid.
3.1
Key points observed based on demographics of travellers (n= 100 respondents)
Gender
wise preference variance
Gender
wise preference variance while preferring Brand
The
result of ANOVA analysis revealed that there is variance between Gender wise
perceptions about preferring Brand names while choosing travel products it may
include hygiene, safety factors due to pandemic. Raw data also analyze that Female
respondents prefer brand names more than males.
Age
Wise
preference variance
The
result of ANOVA analysis revealed that there is variance between Age wise
perceptions about choosing transportation mode as Air travel
The
result of Chi square analysis revealed that there is variance between Age wise
perceptions while choosing the purpose of next trip. Raw
data also indicate majority of respondents prefer to travel for leisure purpose
and maximum respondents preferring leisure travel belong to youth age group.
Occupation
Wise
preference variance
The
result of ANOVA analysis revealed that there is variance between Occupation
wise perceptions about choosing transportation mode as Air travel
Educational
Qualification Wise preference variance
The
result of ANOVA analysis revealed that there is variance between Educational
Qualification wise perceptions about choosing transportation mode as Air travel
The
result of ANOVA analysis revealed that there is variance between Educational
Qualification wise perceptions about choosing transportation mode as Self-drive
- Own vehicle
The
result of ANOVA analysis revealed that there is variance between Educational
Qualification wise perceptions for factors influencing to purchase travel
products post COVID [Promotional offers]
Monthly
Income Wise preference variance
The
result of ANOVA analysis revealed that there is variance between Monthly Income Wise perceptions about choosing
transportation mode as Air travel
Marital
Status Wise preference variance
The
result of ANOVA analysis revealed that there is variance between Monthly Income Wise perceptions about choosing
transportation mode as Air travel
1. The
majority of respondents contributed in this research were young and well educated.
2. Study
interprets that demographic wise preferences of consumers may vary.
3. Majority
of travelers preferred to travel for leisure purpose for their next trip post
COVID.
4. This
study observed that there is variance in gender wise preferences while choosing
brands while female travellers are keener to choose brands due to hygiene and
social distancing related factors. 90.6% female respondents agreed that hygiene
is one of factor influencing them to purchase post COVID while 88.3% females
respondents agreed that social distancing is one of factor influencing them to
purchase post COVID.
5. There
is variance among consumers while preferring Air travel as mode of transport
post COVID while majority of 61.6% young travelers prefer to opt for air
travel.
6. On
parallel track majority of graduate and post graduate respondents prefer to opt
for self-drive as mode of transport post COVID while remaining educational
categories has mix responses which indicate that educated persons are keener to
prefer self-drive.
7. Comparatively
married travellers prefer to opt for air travel as compared to unmarried
travelers.
8. Majority
of 75% travelers responded that they would like to opt for domestic destination
due to multiple factors attached.
Bibliography
Air
Passenger Market Analysis, July 2020. (2020). [online] IATA. Available at:
https://www.iata.org/en/iata-repository/publications/economic-reports/air-passenger-monthly-analysis---july-2020/
[Accessed 25 September 2020].
Dixit Dr. Saurabh, (2012) Tourism Management, APH Publishing Corporation, New
Delhi, ISBN- 978-81-313-1567-5
Dixit Dr. Saurabh, (2012),
Information Technology in Tourism,
APH Publishing Corporation, New Delhi, ISBN- 978-81-313-1591-0
PV, R.,
& Varma, A. J. (2020). A Study of Possible Strategies for Revival of
Tourism Industry-Post COVID-19 with Specific Reference to India-Viewpoint Using
an Exploratory Research. GIS SCIENCE JOURNAL, 7(6).
Sapra, Prateek., Dixit,
Saurabh. (2018). “Branding of Travel Agency Business”, Journal of Emerging
Technologies and Innovative Research, Volume: 5, No: 10
Sapra, Prateek., Dixit,
Saurabh. (2017), “Internet as a Strategy Tool for Development of E-Tourism in
India”, PATH Progressive Approach Tourism and Hospitality, Volume: 1, No: 1
Sapra, Prateek. (2015).
“Use of internet in travel agency marketing”, Sustainable Competitive advantage
through integrated marketing approach, Volume: 1, No: 1
World Air Transport Statistics 2019. (2020). [online] IATA. Available at: https://www.iata.org/contentassets/a686ff624550453e8bf0c9b3f7f0ab26/wats-2019-mediakit.pdf [Accessed 25 September 2020].


This is a nice piece of content...keep writing.
ReplyDeleteWe are experts in pet relocation and we have moved more than 5000 pets worldwide. International Pet Transport| Domestic Pet Transport | Pet Boarding Services in Delhi